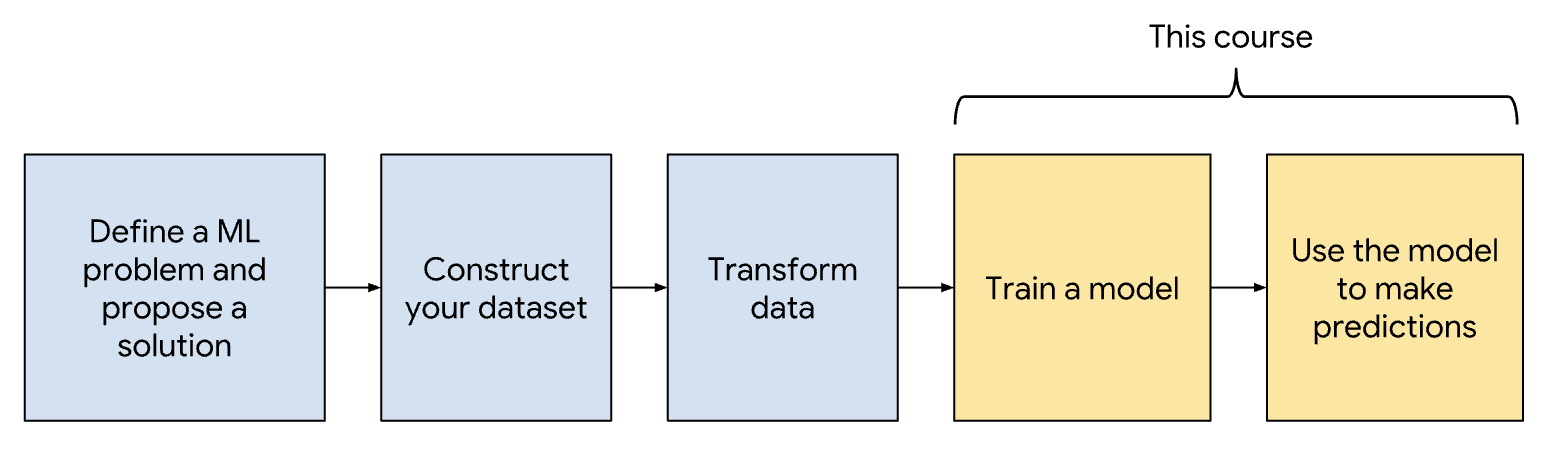
Source1. Testing & Debugging• Testing and debugging machine learning systems differs significantly from testing and debugging traditional software. • This course describes how, starting from debugging your model all the way to monitoring your pipeline in production.
• You debug your ML model to make the model work. Once your model is working, you optimize the model's quality for production-readiness. This section covers both the debugging and optimization steps.1.1. How is ML Debugging Different?• Unlike typical programs, poor quality in an ML model does not imply the presence of a bug. • Instead, to debug poor performance in a model, you investigate a broader range of causes than you would in traditional programming.• For example, here are a few causes for poor model performance:– Features lack predictive power.– Hyperparameters are set to non-optimal values.– Data contains errors and anomalies.– Feature engineering code contains bugs.• Debugging ML models is complicated by the time it takes to run your experiments.1.2. ML Model Development Process• If you follow best practices for developing your ML model, then debugging your ML model will be simpler. These best practices are as follows:1. Start with a simple model that uses one or two features. Starting with a simple, easily debuggable model helps you narrow down the many possible causes for poor model performance.2. Get your model working by trying different features and hyperparameter values. Keep your model as simple as possible to simplify debugging.3. Optimize your model by iteratively trying these changes:i. adding featuresii. tuning hyperparametersiii. increasing model capacity4. After each change to your model, revisit your metrics and check whether model quality increases. If not, then debug your model as described in this course.5. As you iterate, ensure you add complexity to your model slowly and incrementally.• Note: For certain domains like NLP or image recognition, you should start with a complex model.• Programming Exercise1.3. Data and Feature Debugging• Low-quality data will significantly affect your model's performance. • It's much easier to detect low-quality data at input instead of guessing at its existence after your model predicts badly. • Monitor your data by following the advice in this section.1.3.1. Validate Input Data Using a Data Schema• To monitor your data, you should continuously check your data against expected statistical valuesby writing rules that the data must satisfy. • This collection of rules is called a data schema. • • Define a data schema by following these steps:1. For your feature data, understand the range and distribution. For categorical features, understand the set of possible values.2. Encode your understanding into rules defined in the schema. Examples of rules are:* Ensure that user-submitted ratings are always between 1 and 5.* Check that “the” occurs most frequently (for an English text feature).* Check that categorical features have values from a fixed set.3. Test your data against the data schema. Your schema should catch data errors such as:* anomalies* unexpected values of categorical variables* unexpected data distributions1.3.2. Ensure Splits are Good Quality• Your test and training splits must be equally representative of your input data. – If the test and training splits are statistically different, then training data will not help predict the test data. • To learn how to sample and split data, see ?• Monitor the statistical properties of your splits. – If the properties diverge, raise a flag. – Further, test that the ratio of examples in each split stays constant. * For example, if your data is split 80:20, that ratio should not change.1.3.3. Testing Engineered Data• While your raw data might be valid, your model only sees engineered feature data. • Because engineered data looks very different from raw input data, you need to check engineered data separately. • Based on your understanding of your engineered data, write unit tests. • For example, you can write unit tests to check for the following conditions:– All numeric features are scaled, for example, between 0 and 1.– One-hot encoded vectors only contain a single 1 and N-1 zeroes.– Missing data is replaced by mean or default values.– Data distributions after transformation conform to expectations. For example, if you've normalized using z-scores, the mean of the z-scores is 0.– Outliers are handled, such as by scaling or clipping.1.4. Model Debugging• The first step in debugging your model is Data Debugging. • • After debugging your data, follow these steps to continue debugging your model, detailed in the following sections:– Check that the data can predict the labels.– Establish a baseline.– Write and run tests.– Adjust your hyperparameter values.1.4.1. Check that the Model can Predict Labels• Before debugging your model, try to determine whether your features encode predictive signals. • You can find linear correlations between individual features and labels by using correlation matrices. For an example of using correlation matrices, see this Colab.• However, correlation matrices will not detect nonlinear correlations between features and labels. – Instead, choose 10 examples from your dataset that your model can easily learn from. – Alternatively, use synthetic data that is easily learnable. * For instance, a classifier can easily learn linearly-separable examples while a regressor can easily learn labels that correlate highly with a ?. Then, ensure your model can achieve very small loss on these 10 easily-learnable examples.* Using a few examples that are easily learnable simplifies debugging by reducing the opportunities for bugs. * You can further simplify your model by switching to the simpler gradient descent algorithm instead of a more advanced optimization algorithm.
Feature Cross
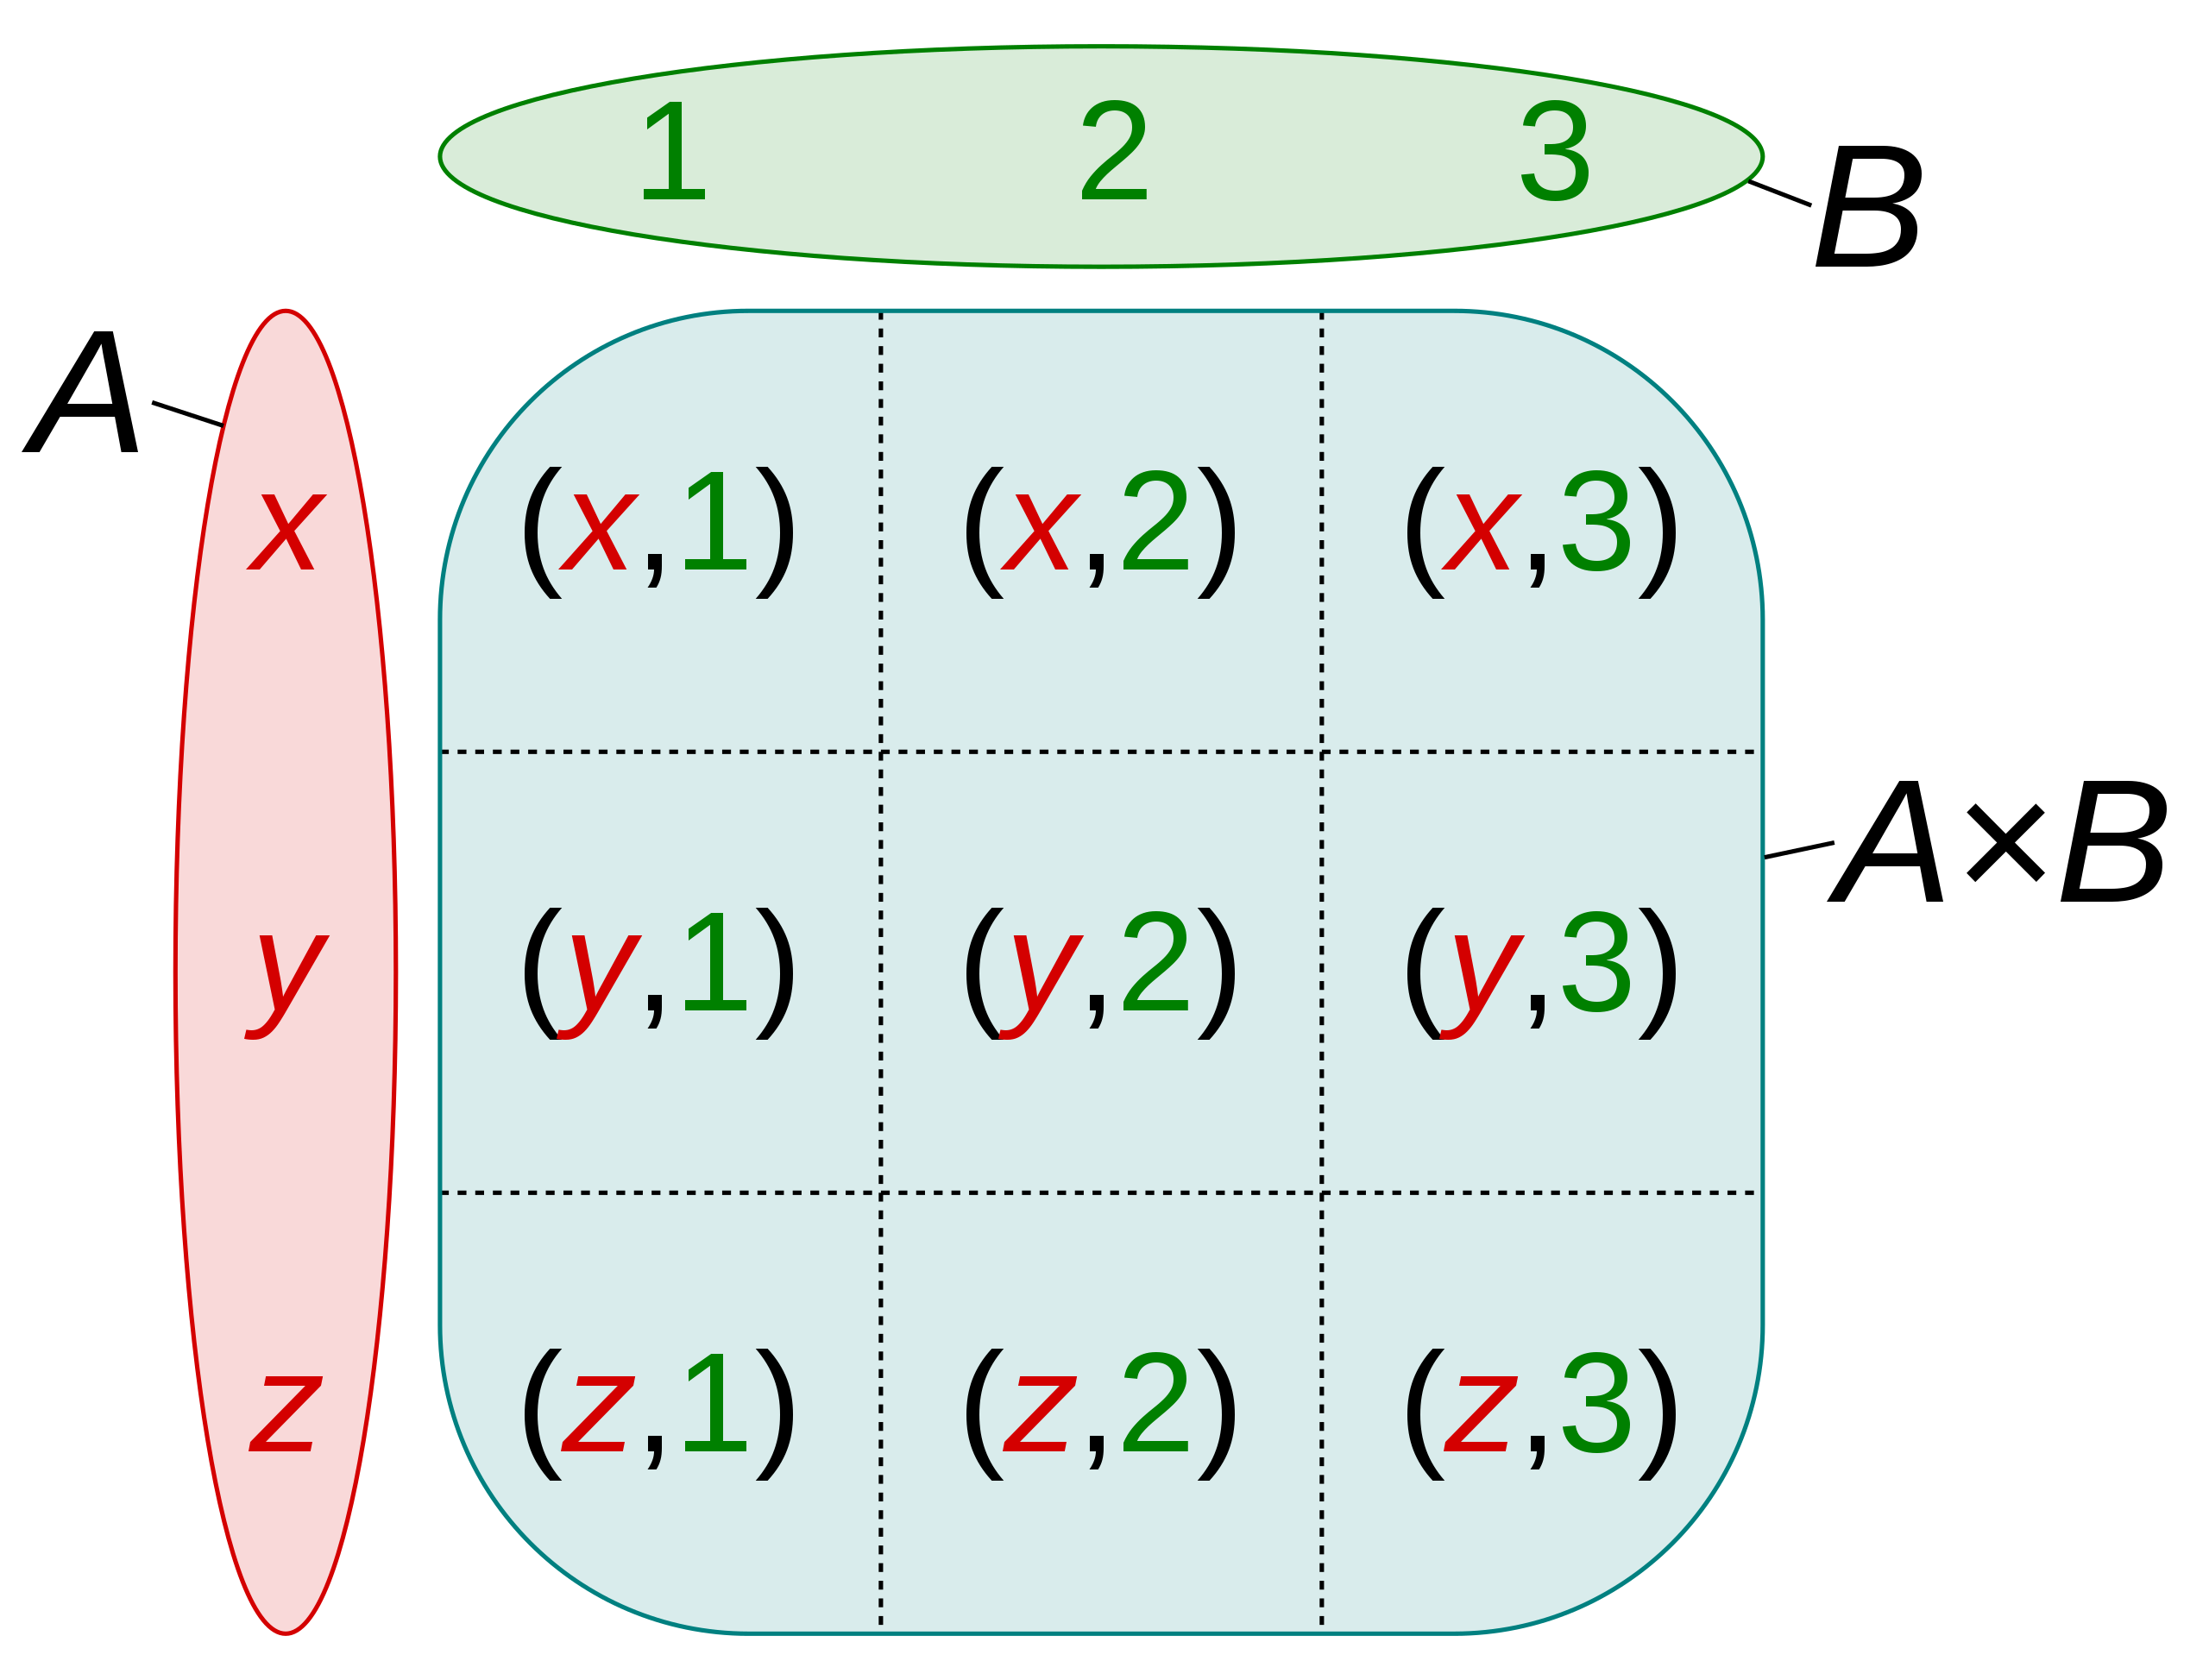
• A synthetic feature formed by "crossing" categorical or bucketed features.• For example, consider a "mood forecasting" model that represents temperature in one of the following four buckets:– freezing– chilly– temperate– warm• And represents wind speed in one of the following three buckets:– still– light– windy• Without feature crosses, the linear model trains independently on each of the preceding seven various buckets. • So, the model trains on, for instance, freezing independently of the training on, for instance, windy.• Alternatively, you could create a feature cross of temperature and wind speed. This synthetic feature would have the following 12 possible values:– freezing-still– freezing-light– freezing-windy– chilly-still– chilly-light– chilly-windy– temperate-still– temperate-light– temperate-windy– warm-still– warm-light– warm-windy• Thanks to feature crosses, the model can learn mood differences between a freezing-windy day and a freezing-still day.• • If you create a synthetic feature from two features that each have a lot of different buckets, the resulting feature cross will have a huge number of possible combinations.– For example, if one feature has 1,000 buckets and the other feature has 2,000 buckets, the resulting feature cross has 2,000,000 buckets.– Formally, a cross is a Cartesian product. → A×B ={(a,b)| a∈A and b∈B}– Feature crosses are mostly used with linear models and are rarely used with neural networks.
Figure 1:Cartesian product of A×B of the setsA={x,y,z} and B={1,2,3}
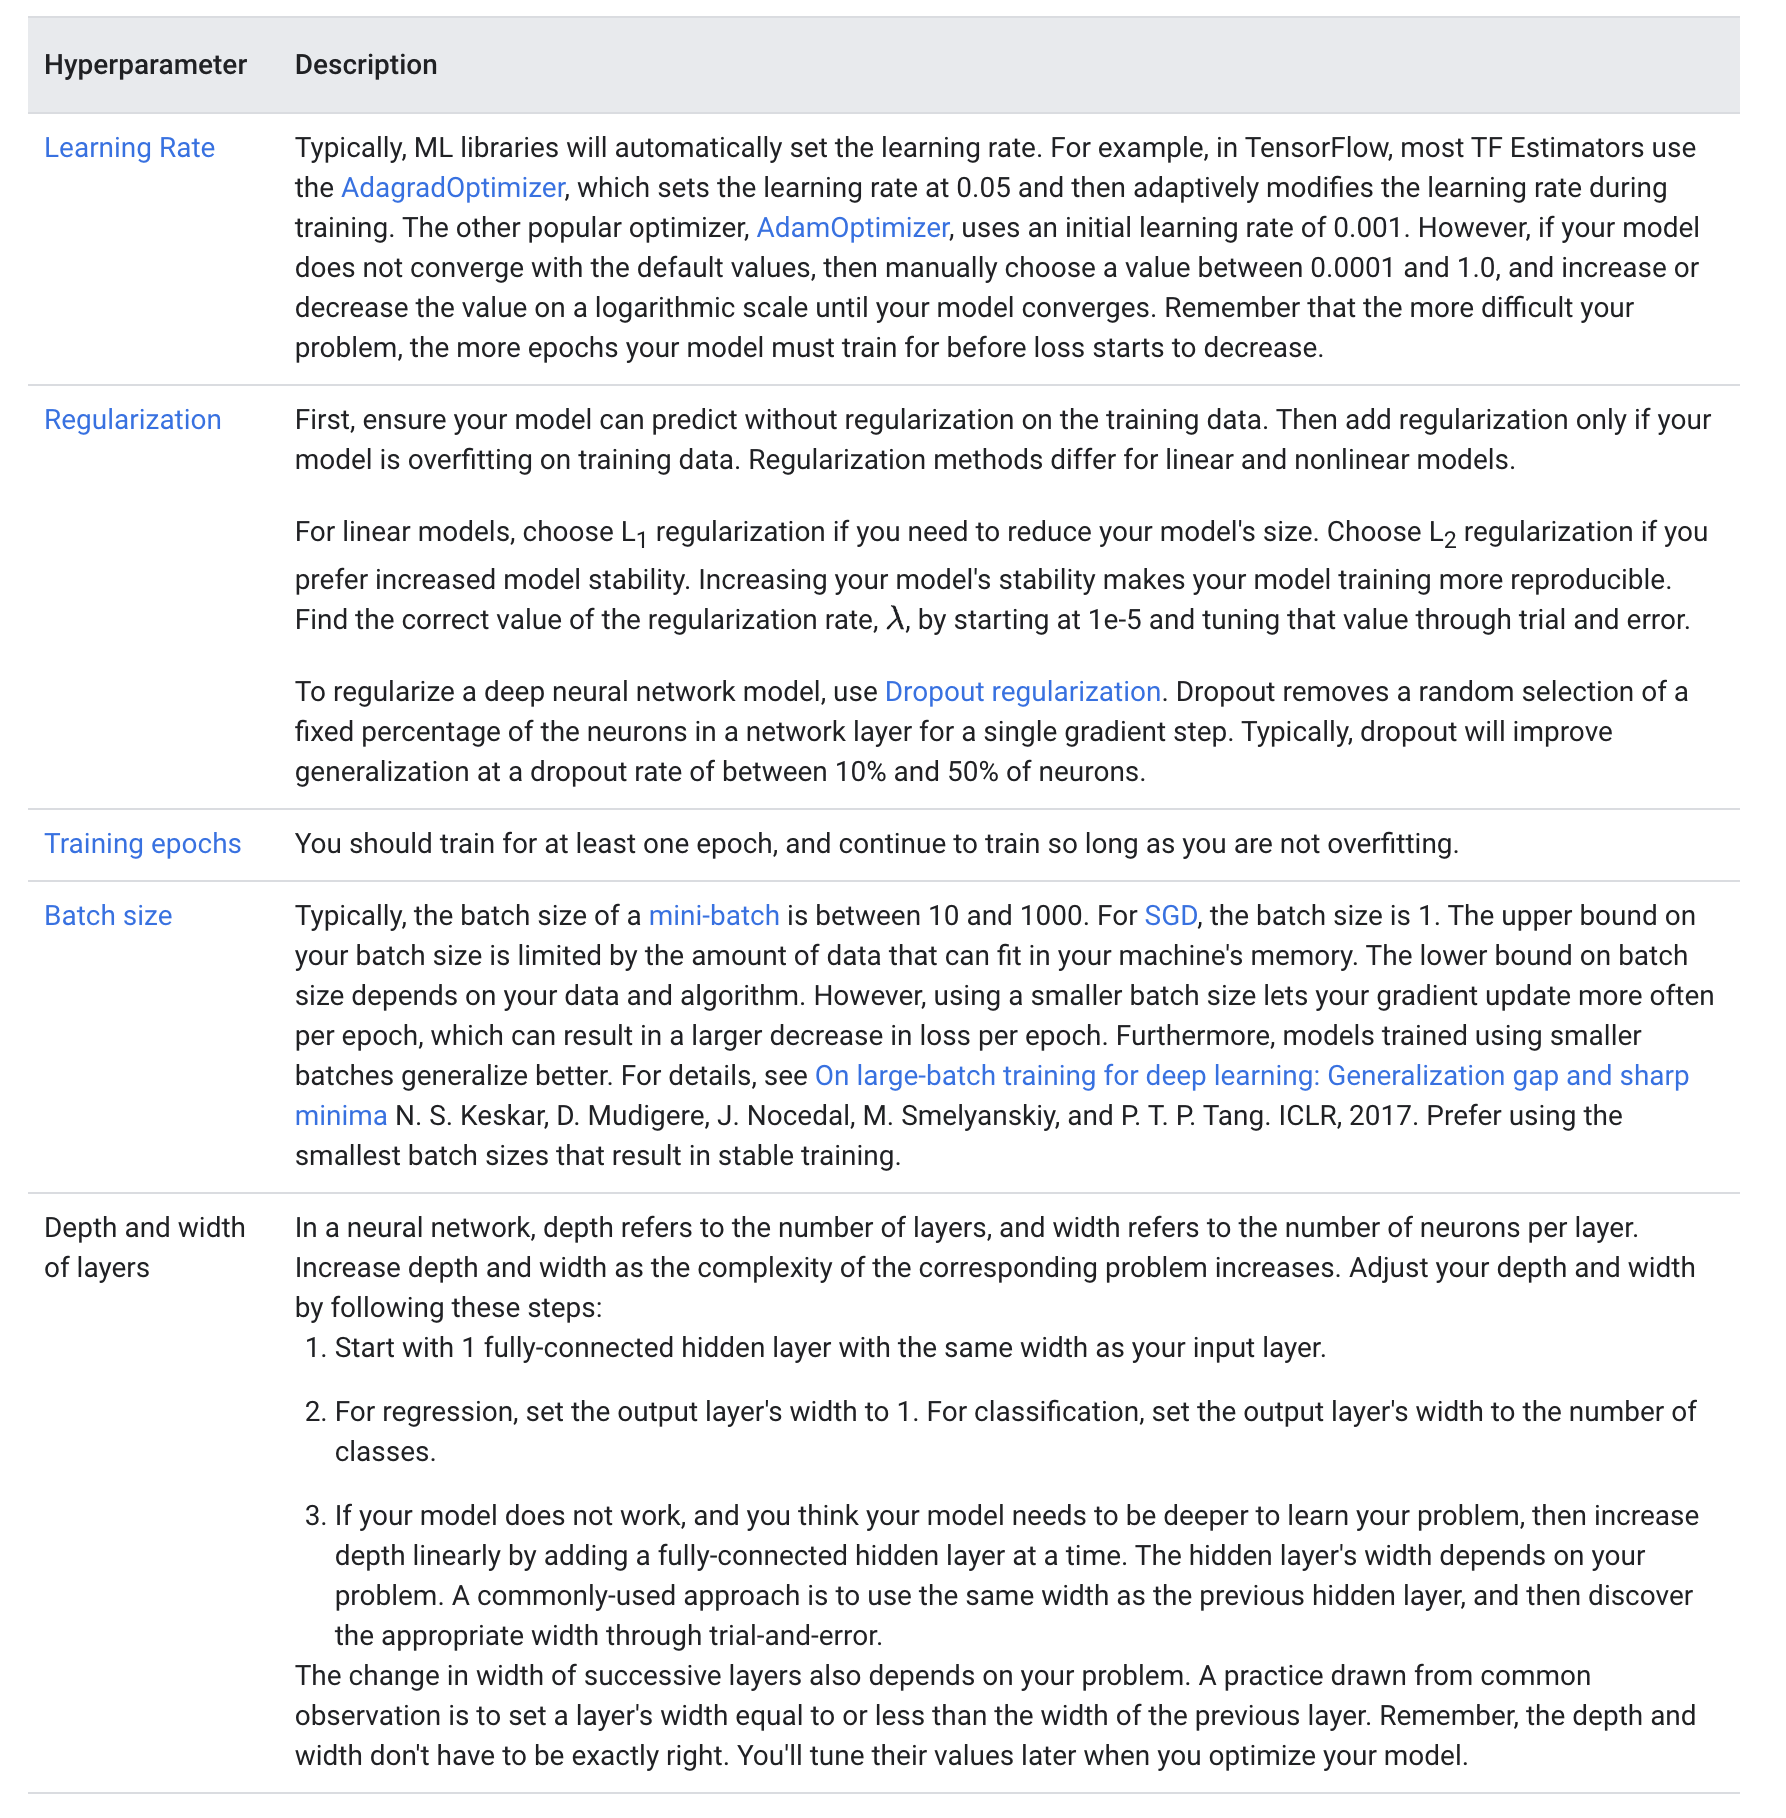
1.4.2. Establish a Baseline• Comparing your model against a baseline is a quick test of the model's quality. • When developing a new model, define a baseline by using a simple heuristic to predict the label. • If your trained model performs worse than its baseline, you need to improve your model.• Example of baselines are:– Using a linear model trained solely on the most predictive feature.– In classification, always predicting the most common label.– In regression, always predicting the mean value.• Once you validate a version of your model in production, you can use that model version as a baseline for newer model versions. – Therefore, you can have multiple baselines of different complexities. – Testing against baselines helps justify adding complexity to your model. – A more complex model should always perform better than a less complex model or baseline.1.4.3. Implement Tests for ML Code• The testing process to catch bugs in ML code is similar to the testing process in traditional debugging. You'll write unit tests to detect bugs. • Examples of code bugs in ML are:– Hidden layers that are configured incorrectly.– Data normalization code that returns NaNs.– A sanity check for the presence of code bugs is to include your label in your features and train your model. If your model does not work, then it definitely has a bug.– 1.4.4. Adjust Hyperparameters• The table below explains how to adjust values for your hyperparameters.
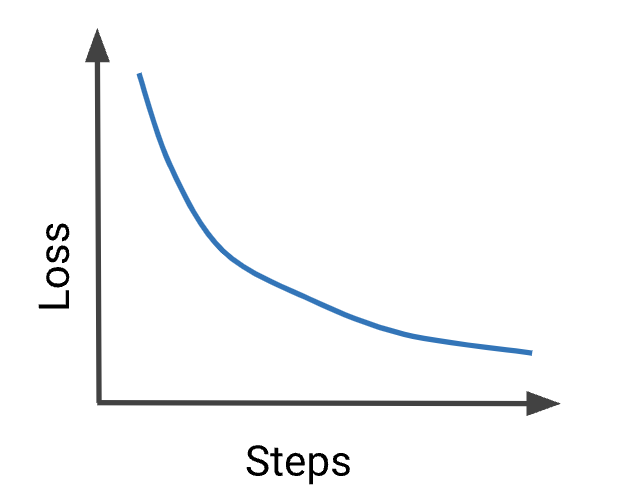
1.5. Interpreting Loss Curves• Machine learning would be a breeze if all our loss curves looked like this the first time we trained our model:
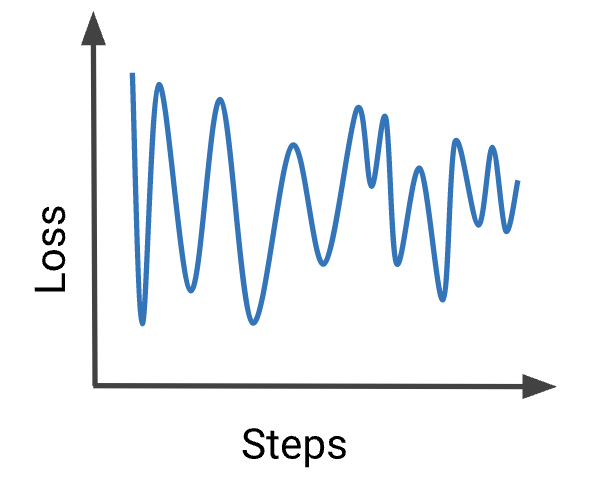
• But in reality, loss curves can be quite challenging to interpret.1.5.1. My Model Won't Train!
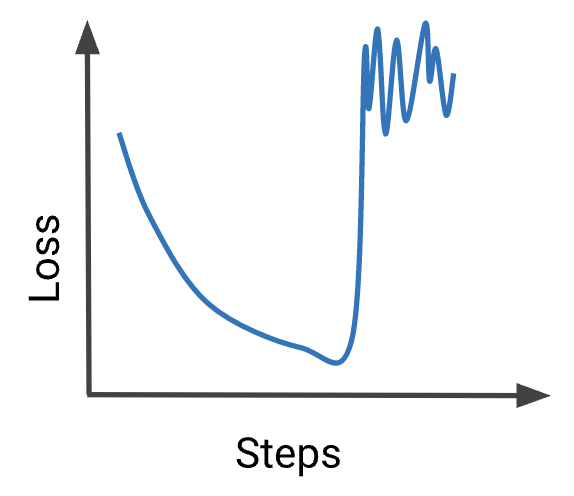
• Your model is not converging. Try these debugging steps:– Check if your features can predict the labels by following the steps in Model Debugging.– Check your data against a data schema to detect bad examples.– If training looks unstable, as in this plot, then reduce your learning rate to prevent the model from bouncing around in parameter space.– Simplify your dataset to 10 examples that you know your model can predict on. Obtain a very low loss on the reduced dataset. Then continue debugging your model on the full dataset.– Simplify your model and ensure the model outperforms your baseline. Then incrementally add complexity to the model.1.5.2. My Loss Exploded
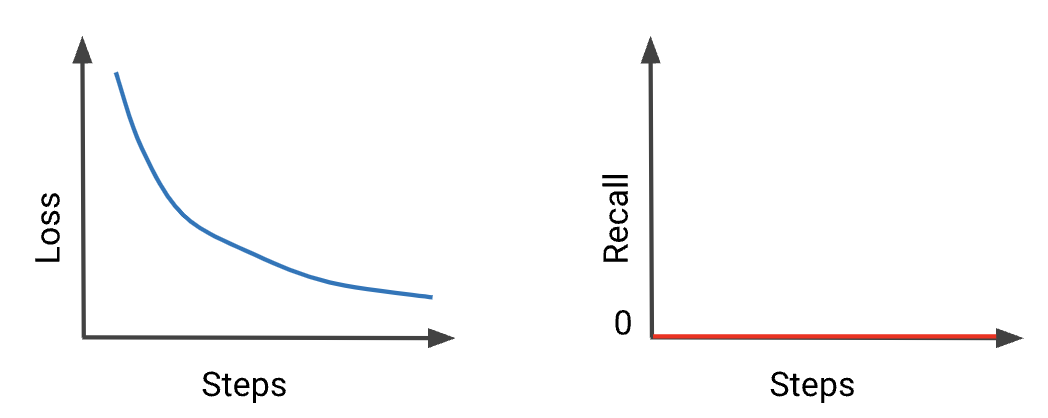
• A large increase in loss is typically caused by anomalous values in input data. Possible causes are:– NaNs in input data.– Exploding gradient due to anomalous data.– Division by zero.– Logarithm of zero or negative numbers.• To fix an exploding loss, check for anomalous data in your batches, and in your engineered data. • If the anomaly appears problematic, then investigate the cause. – Otherwise, if the anomaly looks like outlying data, then ensure the outliers are evenly distributed between batches by shuffling your data.– 1.5.3. My Metrics are Contradictory!
• Recall is stuck at 0 because your examples' classification probability is never higher than the threshold for positive classification. • This situation often occurs in problems with a large class imbalance. • Note: Remember that ML libraries, such as TF Keras, typically use a default threshold of 0.5 to calculate classification metrics.• • Try these steps:– Lower your classification threshold.– Check threshold-invariant metrics, such as AUC.1.5.4. Testing Loss is Too Damn High!