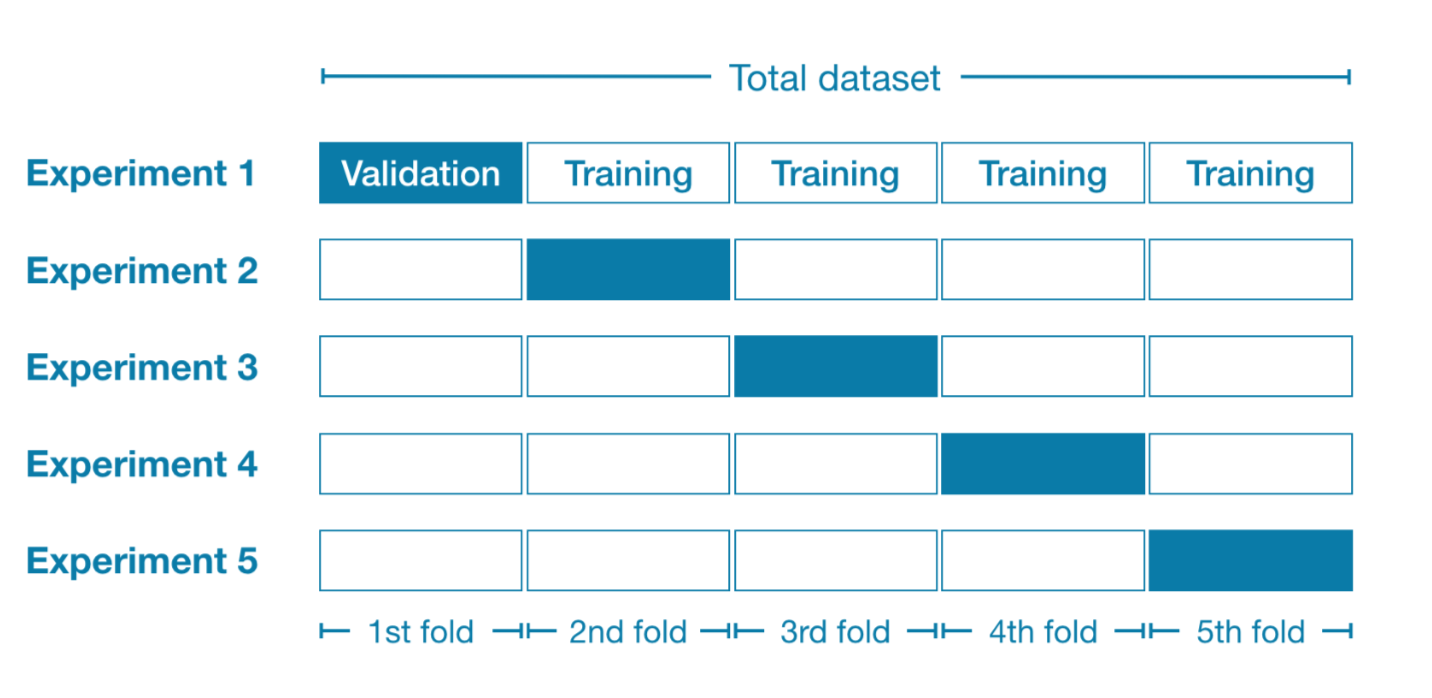
1. Cross Validation (CV)• How do we decide which ML model is the best with our data?• CV allows us to compare different ML methods and get a sense of how well they work in practice.• CV is composed of two main steps:– Train the ML model on some part of the data → training data– Evaluate the trained model on the rest of the data → validation/test data• Note: The reason for training the model on only a part of data (training data) is to evaluate the ML model performance on a data it hasn't seen (validation data)• Note: To make sure model evaluations are not biased, CV methods divide the data into a few blocks (or folds) test the model performance one block at a time.
Figure 1:5-fold Cross Validation
• Leave-one-out-CV: It's a CV where the size of each block is each individual observation.• Another application of CV is tuning model hyperparameters.
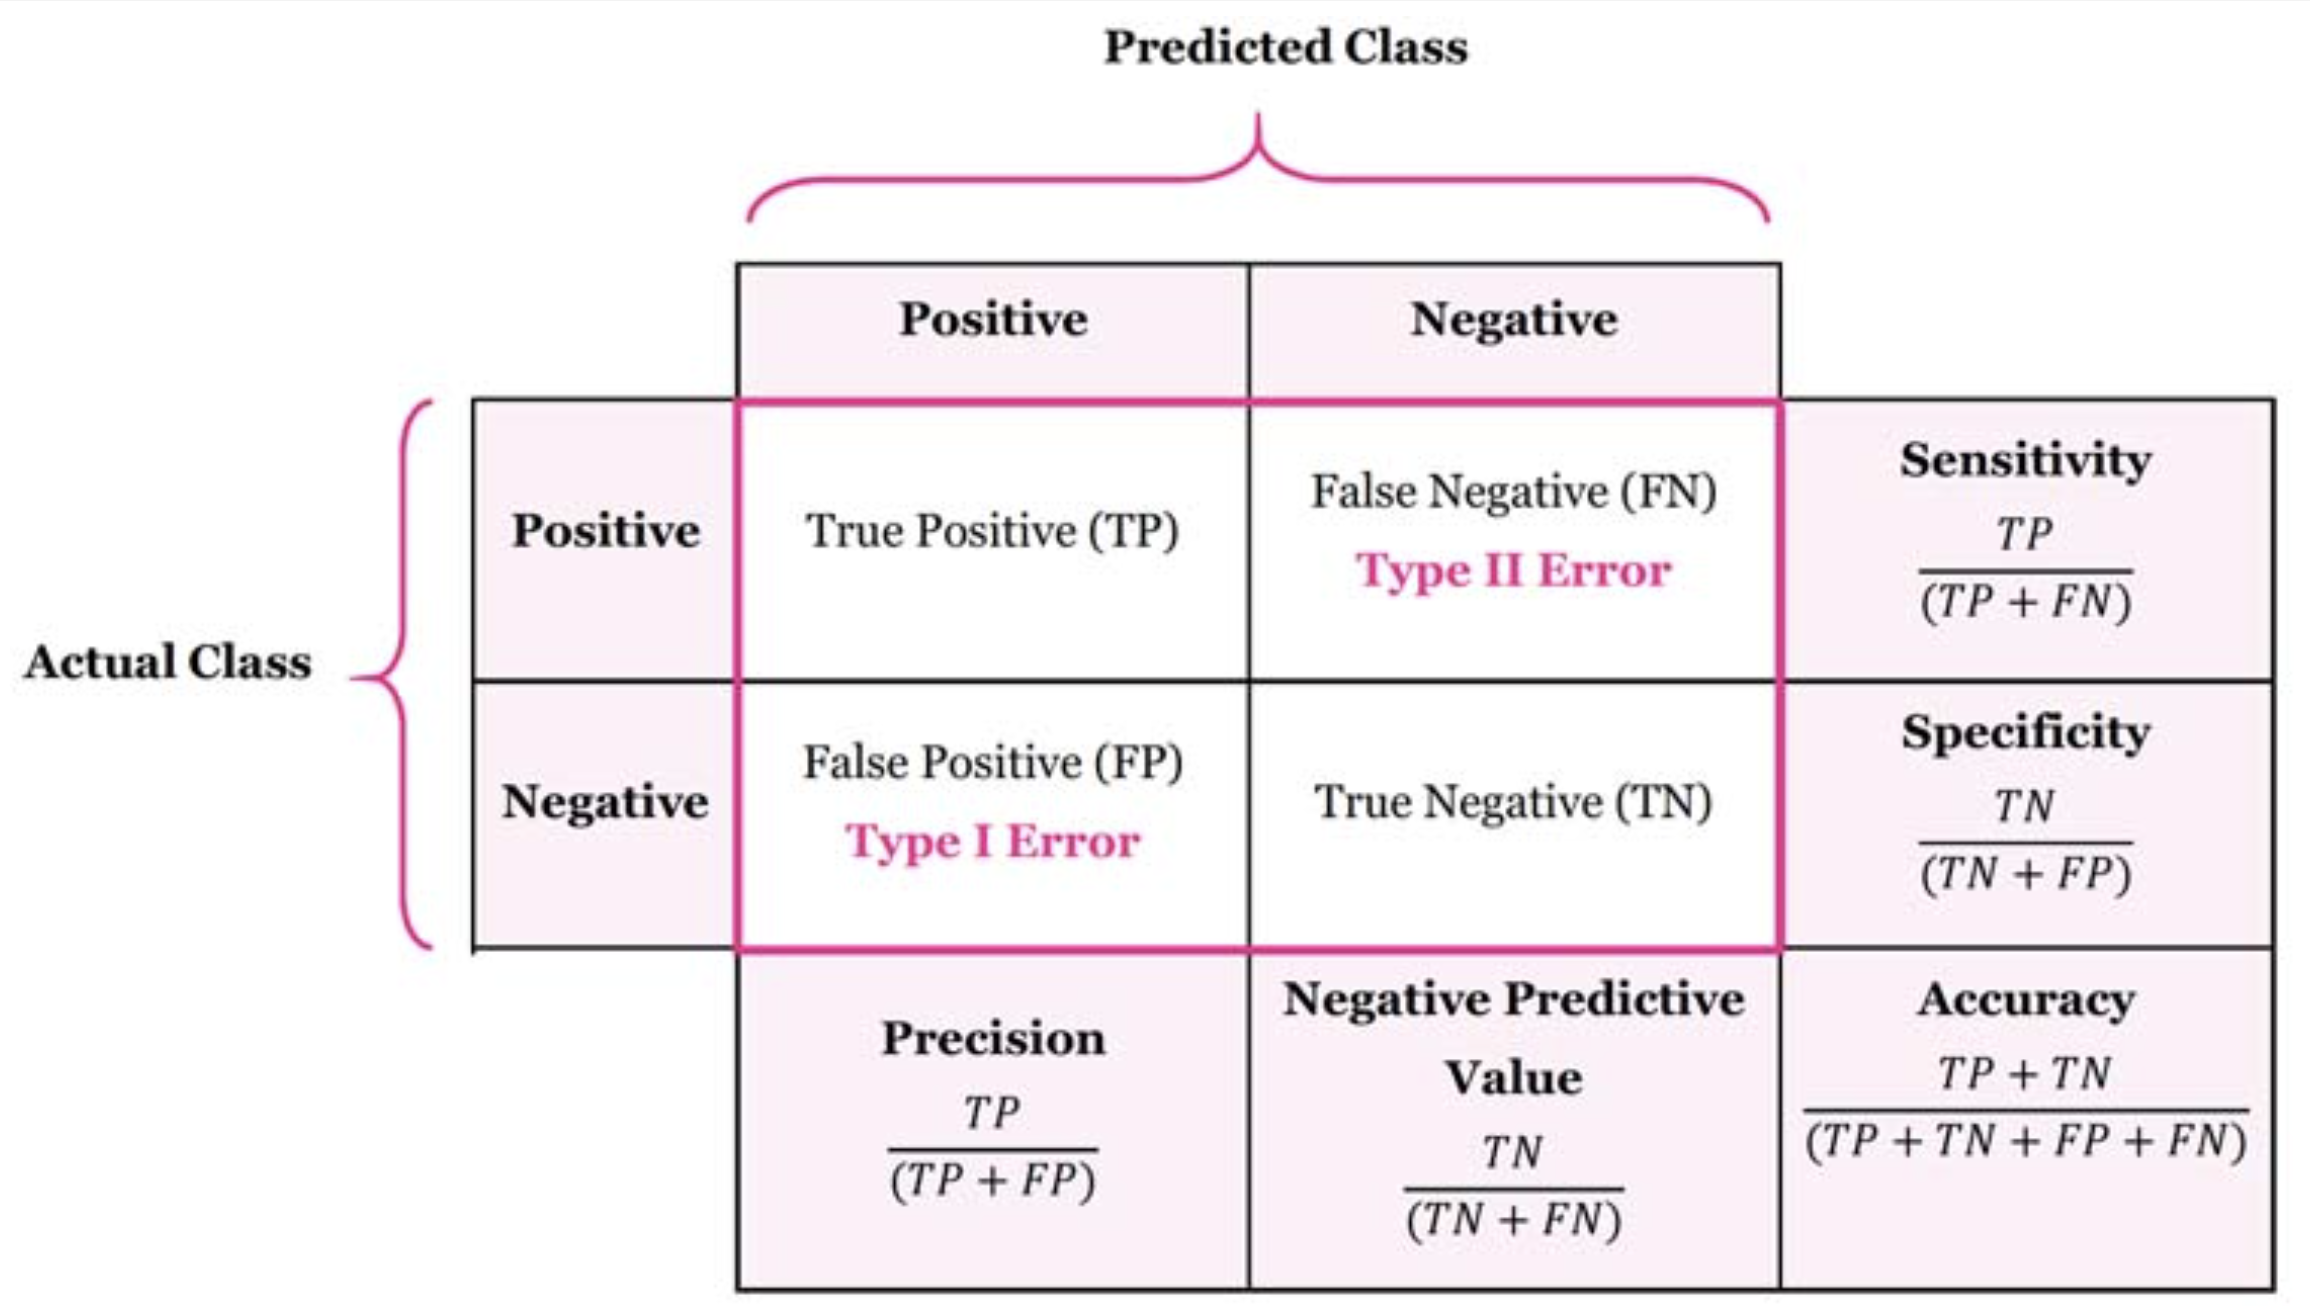
2. Confusion Matrix• Again, we start with the same question; how do we compare different ML models?• Based on Section 1., we first divide the data into training and validation. Then, we train the model and create predictions on validation data.• To summarize how each model performed, we can use a confusion matrix.
Figure 2:Confusion Matrix
• The numbers on the diagonal tell us how many times the samples were correctly classified.• The size of confusion matrix is defined by the number of things we want to predict.
3. Sensitivity and Specificity• When the confusion matrix numbers for two models are close, how do we decide which model is better?– Sensitivity tells us the percentage of positives that are correctly predicted as positive.– Specificity tells us the percentage of negative that are correctly predicted as negative.– Each of Sensitivity or Specificity are used based on how important it is to correctly predict positives or negatives, respectively. * For example, in predicting if a person has cancer, correctly predicting negative cases (no cancer) are more important. Or when predicting if someone has COVID, we'd want to be able to identify all the positives, even though it may result in more False Positives.
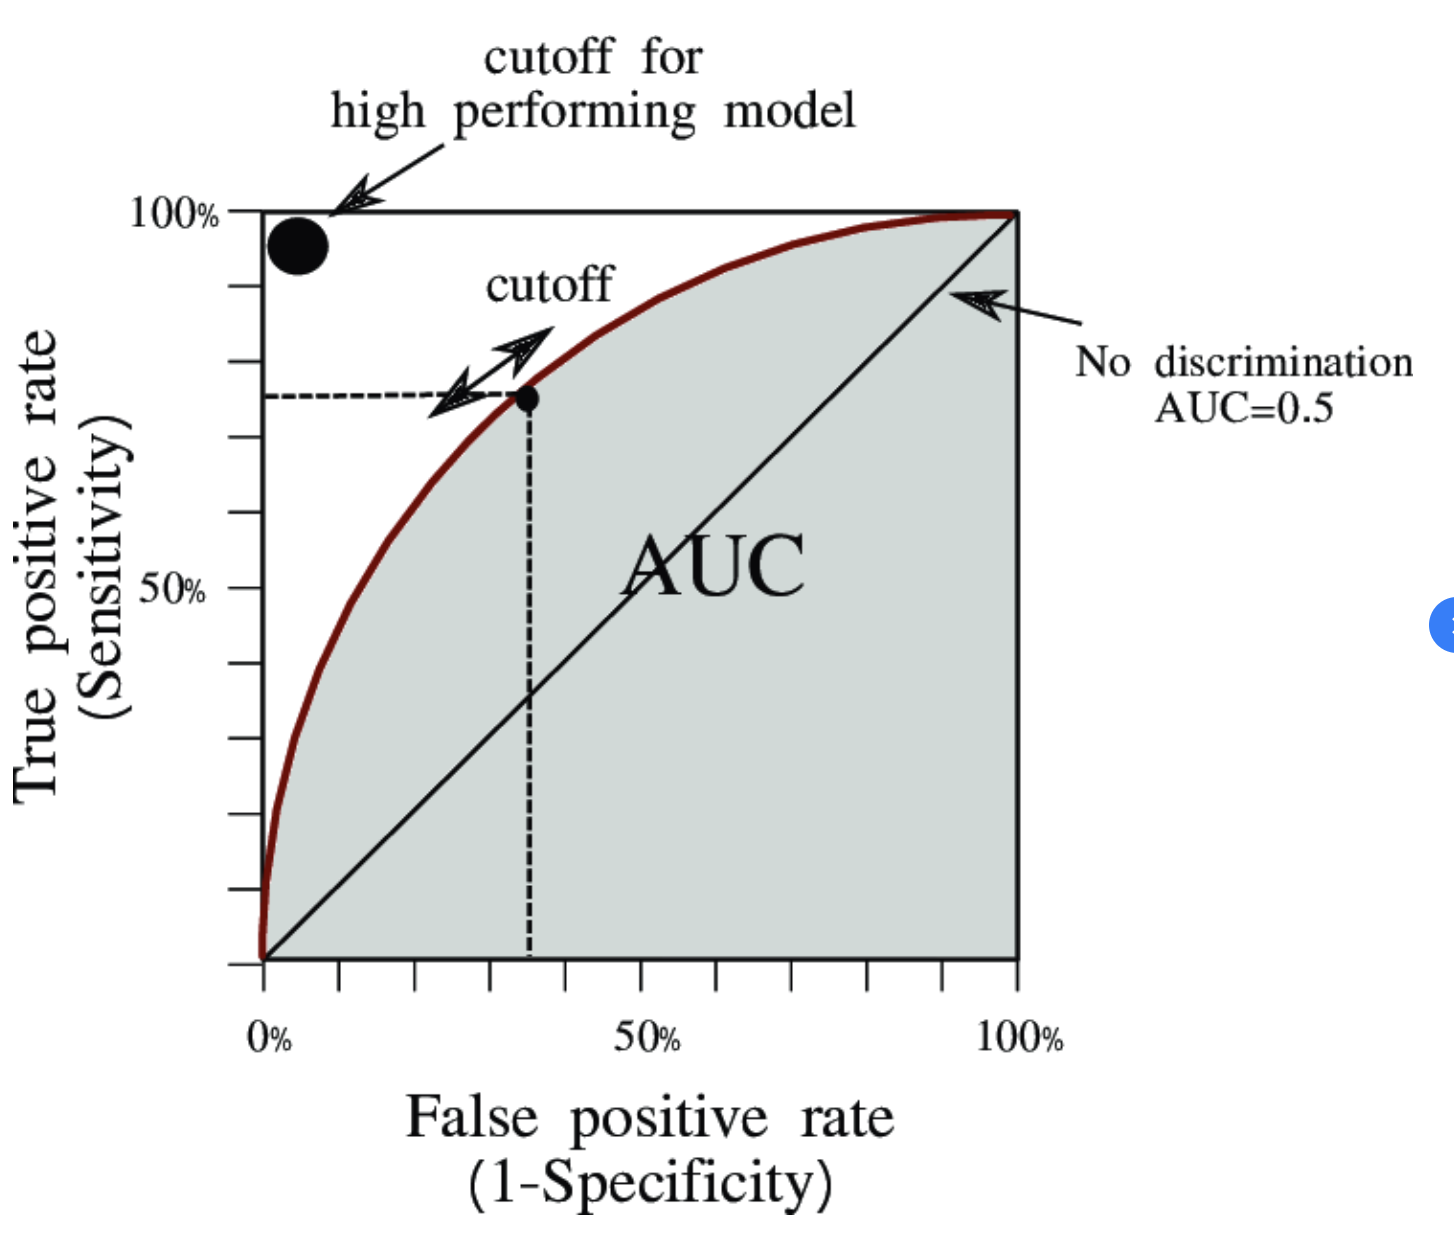
4. ROC and AUC• Some ML models produce probabilities (instead of 0, 1) for each class. Eventually, we need to decide on a threshold to transform probabilities to class predictions.– For binary classification, the threshold is usually set to 0.5.• Depending on the data, the probability cutoff (threshold) point can impact the model performance (e.g. confusion matrix) values.• How do we determine which threshold is the best?– The brute force way would be to try many thresholds, but that's cumbersome.– Receiver Operator Characteristic (ROC) graphs provide a simple way to summarize all of the information.
Figure 3:ROC Curve & AUC
• The diagonal line shows where True Positive Rate = False Positive Rate. Any point on this line means that the proportion of correctly classified positives is the same as the proportion of negatives that are incorrectly classified.• The AUC (Area Under Curve) makes it easy to compare one ROC curve to another ROC curve.• Note: In some cases (imbalanced datasets, predicting rare diseases), some change False Positive Rate with Precision.