1. What p-values Are And How To Interpret Them?• Imagine we have two drugs: Drug A & Drug B. • We want to know if Drug A is different from Drug B.• Let's say we give Drug A to 1 person and Drug B to another person. The one with Drug A is healed and the other one doesn't. Can we conclude Drug A is better than Drug B? No, because person with Drug B might have not healed for many different reasons. • We have to give the drugs to many more people.– Let's say we give each drug to 1000 different people and Drug A cures 995 of them vs. Drug B only curing 7 of the people.– In this case, we can conclude Drug A is better than Drug B (it'd be unrealistic to assume that all these results is due to random chance).• What if this was the result? How confident we are that Drug A is better?– Drug A: 73 cured, 125 not cured (37% cured)– Drug B: 59 cured, 131 not cured (31% cured)– This is where we use p-values.• p-values are numbers between 0 and 1 that quantify how confident we should be about a hypothesis (in our example, Drug A is different from Drug B)– The closer a p-value to 0, the more confidence we have in our hypothesis to be true.– • How small does a p-value have to be before we are significantly confident our hypothesis is true?– In practice, a commonly used threshold is 0.05. – In our example, it means that if there is no difference between Drug A and Drug B, and if we did this exact same experiment a bunch of times, then only 5% of those experiments would result in the wrong decision.• One way to calculate p-value is through Fisher's Exact Test.• Getting a small p-value when there is no difference is called a False Positive.• • Note: A 0.05 threshold for p-values means that 5% of the experiments, where the only differences come from weird random things, will generate a p-value smaller than 0.05.– In our example, if there's no difference between Drug A and Drug B, 5% of the time we the experiment, we'll get a p-value less than 0.05, aka a False Positive.– Note: If it's extremely important that we are correct when we say the drugs are different, then we can use a smaller threshold like 0.00001 (i.e. we only get a False Positive once every 100,000 experiments).* Likewise, if it's not that important, we can use a larger threshold like 0.2 (i.e. we're willing to get a False Positive 2 times out of 10).* • In statistics, the idea of trying to determine if these drugs are the same or not is called Hypothesis Testing.– The Null Hypothesis is that the drugs are the same and the p-value helps us decide if we should reject the Null Hypothesis or not.– • Note:While small p-values helps us decide if Drug A is different from Drug B, it does NOT tell us how different they are.– In other words, you can have a small p-value regardless of the size of difference between Drug A and B. The difference can be tiny or huge.– For example this example gives us p-value of 0.24 although the difference between A and B is 6 points.* Drug A: 73 cured, 125 Not Cured (37%)* Drug B: 59 Cured, 131 Not Cured (31%)– Whereas in this example the p-value is 0.04 although the difference is only 1 point.* Drug A: 5005 cured, 9868 Not Cured (34%)* Drug B: 4800 Cured, 9000 Not Cured (35%)– In summary, a small p-value does not imply that the effect size between A and B is large.
2. How to Calculate p-values?2.1. Two-Sided p-values• There are two types of p-values:– One-sided– Two-sided• Two-sided p-values are the most common (and we focus on them in this section).– One-sided p-values preferrably should be avoided.• p-values are determined by adding up probabilities.• Example:What's the p-value of getting 2 Heads in tossing a coin?– There are 4 possibilities (along with their probabilities):* (HEADS, HEADS) → 0.25* (TAILS, TAILS) → 0.25* (HEADS, TAILS) or (TAILS, HEADS) → 0.5– Note: Since tossing a coin is i.i.d. (i.e. getting HEADS in the first toss doesn't impact what you get in the second toss), we treat (HEADS, TAILS) and (TAILS, HEADS) as the same event.– A p-value is composed of three (additive) parts: 1. The probability that random chance would result in the observation. 2. The probability of observing something else that is equally rare. 3. The probability of observing something rarer or more extreme.• In our example the p-value for getting 2 HEADS = 0.25+0.25+0 = 0.5– In our example, the Null Hypothesis is: Even though I got 2 HEADS in a row, my coin is no different from a normal coin.– • Now, let's calculate the p-value for getting 4 HEADS and 1 TAILS.– Here's all the possibilities (32 possibilities in total):* 5H & 0T → 1* 4H & 1T → 5* 3H & 2T → 10* 2H & 3T → 10* 1H & 4T → 5* 0H & 5T → 1– The p-value of 4H & 1T is:* Part 1: The probability we randomly get 4H & 1T = 5
32* Part 2: The probability we randomly get something else that is equally rare (i.e. 1H & 4T) = 5
32* Part 3: The probability we randomly get something rarer or more extreme (i.e. 5H and 5T) = 2
32* Therefore, the p-value = 5
32+5
32+2
32=12
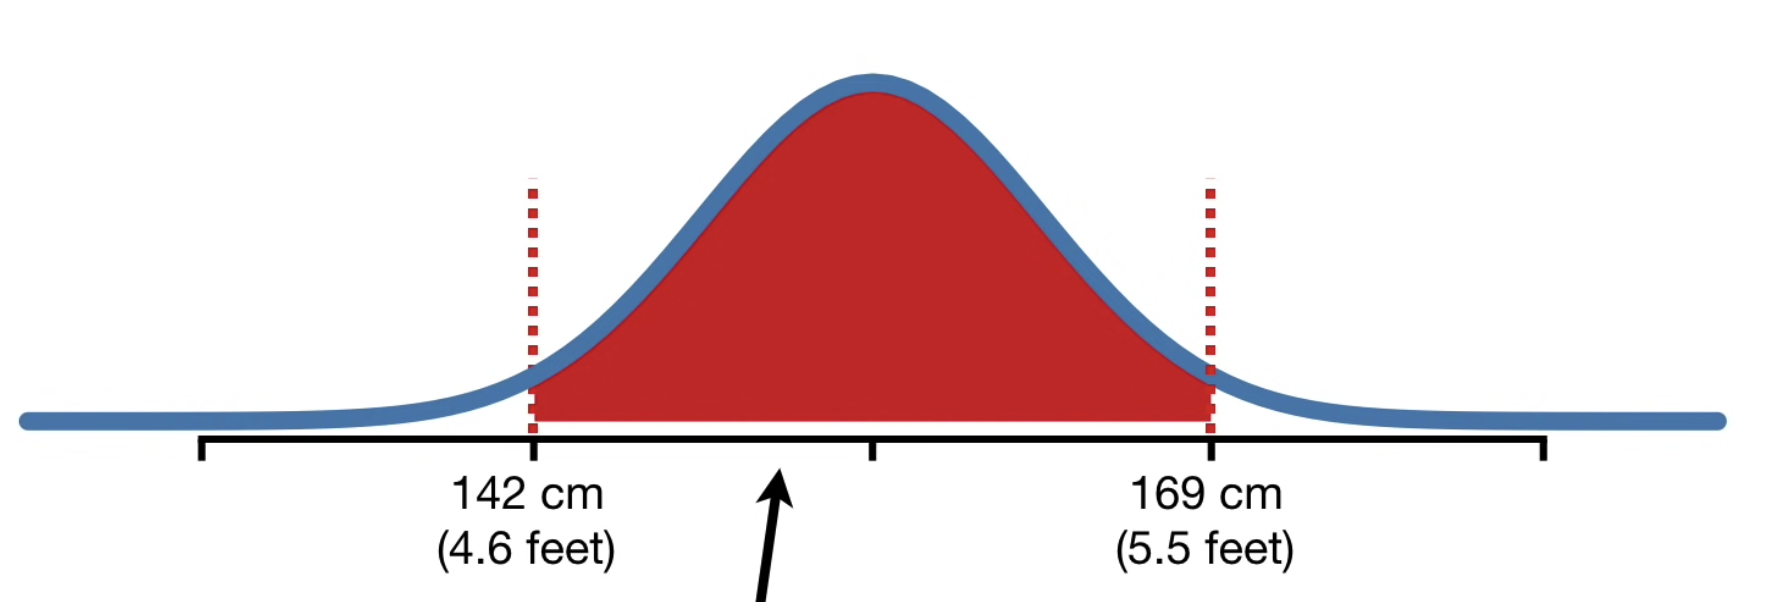
32= 0.375 → The null hypothesis (coin is special) cannot be rejected.Why do we care about things that are equally rare or more extreme?• We add part 2 (the probability of something else that is equally rare) because although getting 2 HEADS seem special, it doesn't seem as special when we know that other things are just as rare.• Similarly, part 3 conveys that if there are rarer events that 2 HEADS, then getting 2 HEADS is not that special. (In this case there's no rarer even than 2 HEADS, so part 3 is 0).How do we calculate p-value for continuous values?• Example of such is people's height.• For such cases, we use their distribution.• The area under the probability distribution curve shows that probability of being between two values. – For example, the picture below shows that 95% of the area under the curve is between 142 and 169 cm. In other words, if that's the height distribution for a sample, there's a 95% probability that each time we measure someone from the sample, her height is between 142 and 169.
Figure 1:Area under the probability distribution curve
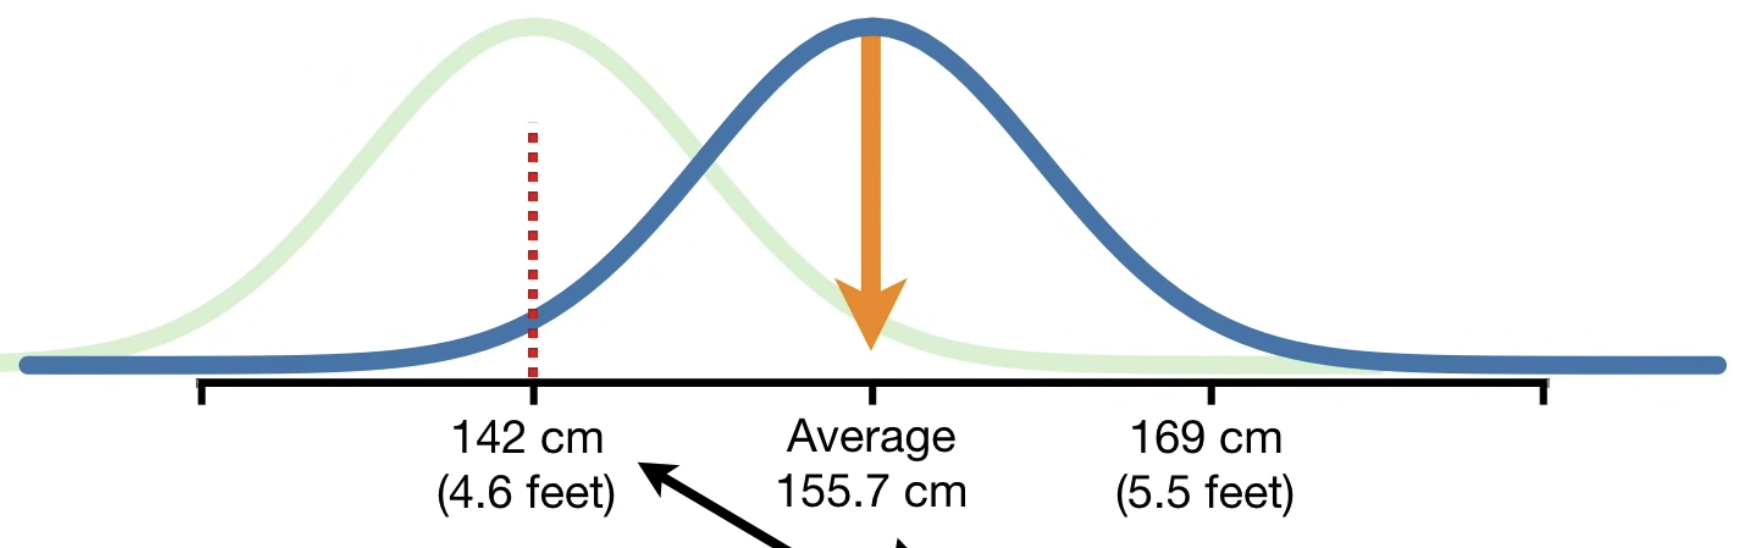
• To calculate p-values with a distribution, you add up the percentages of area under the curve. For example:– Imagine we measured someone who is 142 cm tall.– We might wonder if it came from the distribution (shown above) which has an average of 155.7 cm, or if it came from another distribution of heights (for example the green distribution that has an average value of 142)
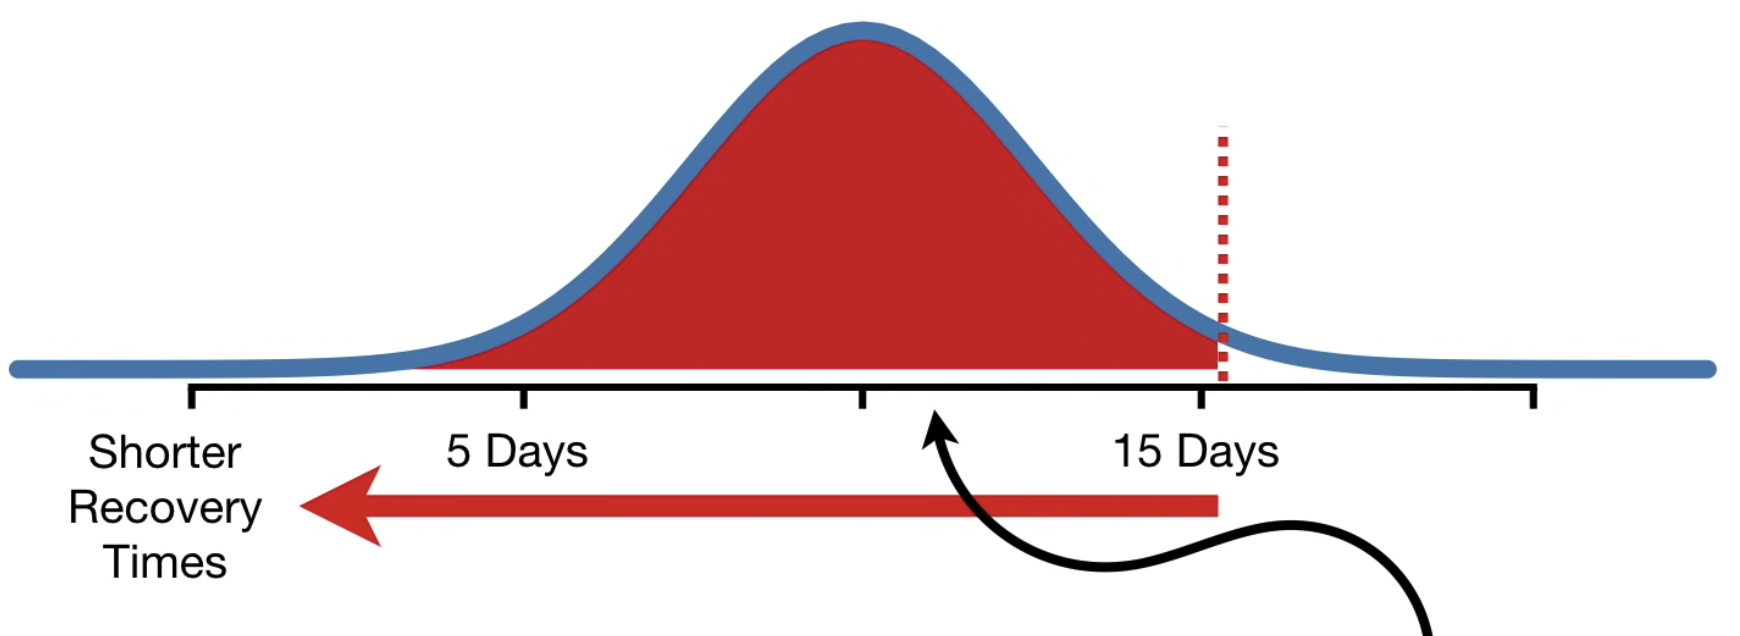
• The question is: Is this measurement, 142 cm, so far away from the mean of the blue distribution (155.7 cm) that we can reject the idea that it came from it?– If so, then that would suggest that another distribution, like the green one, might do a better job explaining the data.• The p-value of 142 cm measurement coming the blue distribution = 0.025 + 0.025 = 0.05.– In this case, we can't really tell since the p-value is exactly equal to the threshold. 142 may or may not come from the blue distribution. In other words, there's not enough data to tell.• The p-value for 141 = 0.016 + 0.016 = 0.03 → here we can reject the null hypothesis.2.2. One-Sided p-values• Imagine we measured how long it took a bunch of people to recover from an illness.• Now, imagine we created a new drug, SuperDrug, and wanted to see if it helped people recover in fewer days.• If we give SuperDrug to a bunch of people and the average recovery was 4.5 days, then a two-sided p-value would be = 0.016 + 0.016 = 0.03 → SuperDrug performance be better explained by some other distribution (not the blue one).
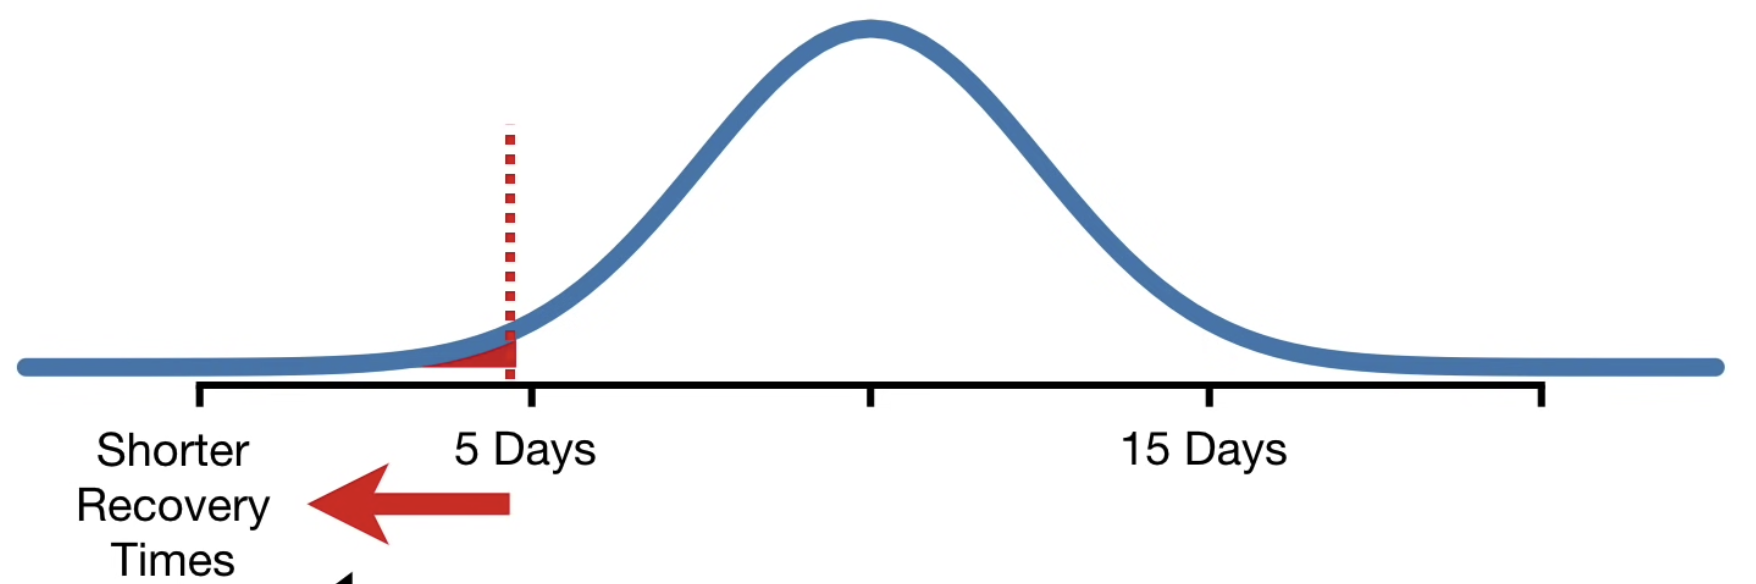
• For a one-sided p-value, the first thing we do is decide which direction we want to change in.• In this case, we'd like SuperDrug to shorten the time it takes to recover from the illness (i.e. we want to see if recovery time is shorter).• Therefore, the only more extreme values are < 4.5 days.
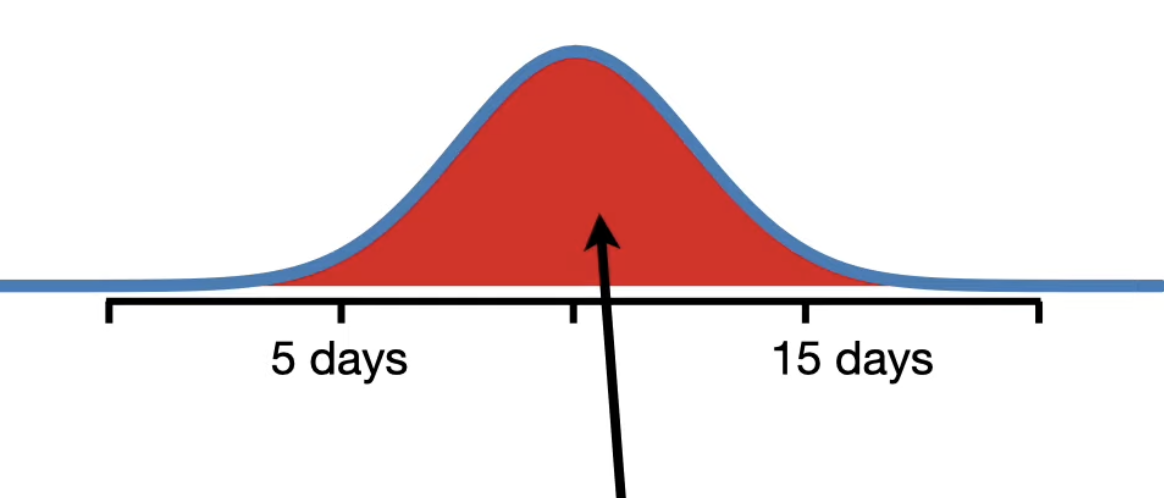
• All of the values > 4.5 days are considered less extreme.• So, when calculating a one-sided p-value, we only use the area that is in the direction we want to see change, i.e. one-sided p-value for 4.5 days = 0.016.• Now, imagine that SuperDrug average recovery days is 15.5 days.– In this case, the two-sided p-value would still be = 0.016 + 0.016 = 0.03.– In other words, regardless of whether SuperDrug is super or not, a two-sided p-value will detect something unusual happened. – For one-sided p-value, we first decide the direction, i.e. we want to see if the recovery time is shorter. – So, the one-sided p-value is the huge area under the curve, 0.98, because it is more extreme in the direction we want to see change. – Therefore, the one-sided p-value will not detect if SuperDrug is doing anything unusual.•
• The one-sided p-value is only looking to see if a distribution to the left of the original mean makes more sense and since the observation is on the right side of the mean, we fail to reject the hypothesis that the original distribution makes sense.• Since failing to detect that SuperDrug is making things worse would be bad, one-sided p-values are tricky and should be avoided, or only used by experts who really know what they're doing.
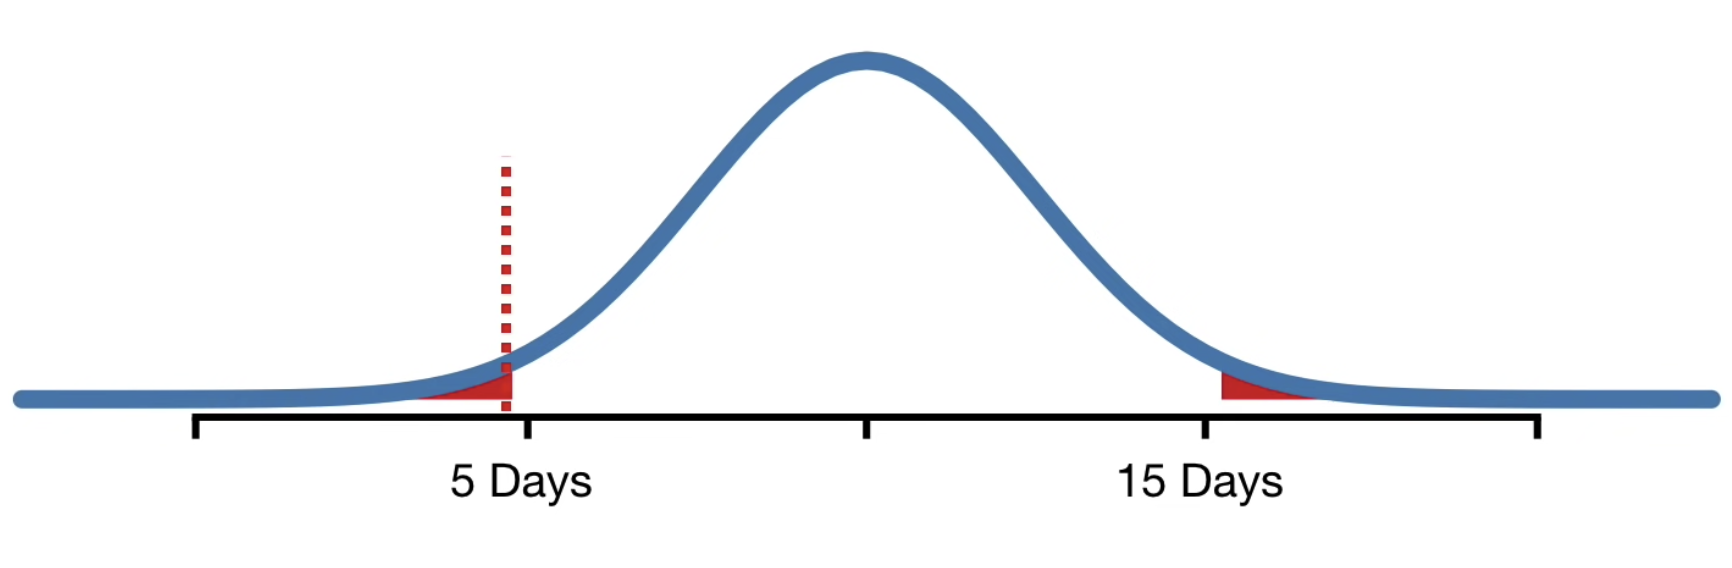
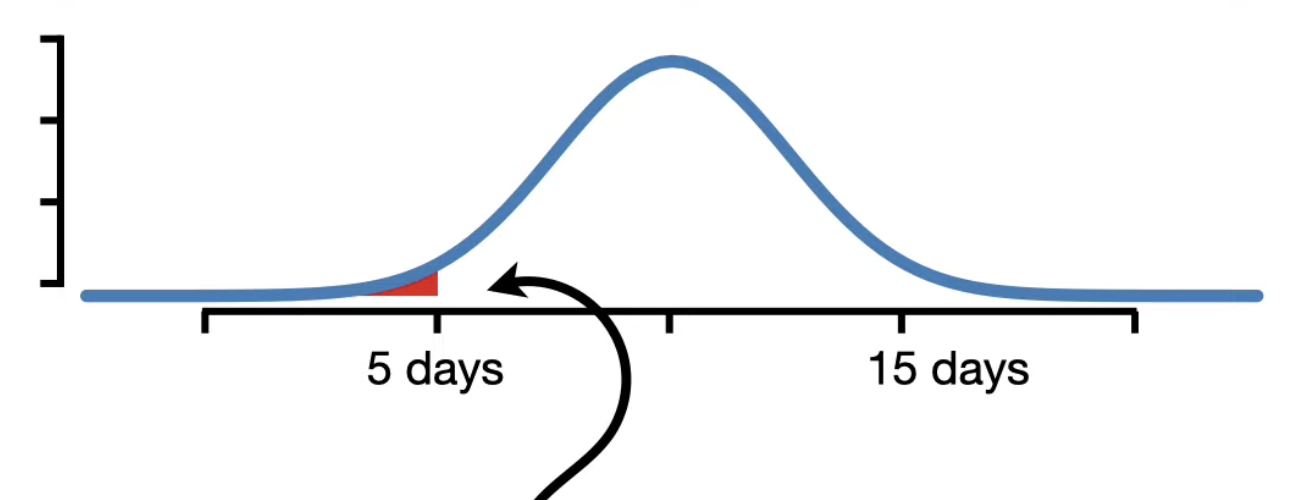
3. p-Hacking• Imagine there was virus and we want to develop a drug to reduce the time it took to recover from it. So, we created a bunch of candidate drugs and we tested each one to see if any of them worked.• We measured the recovery time for three people with and without drugs. • We calculate the mean of two groups and do a statistical test to compare the means.• Imagine for one of the drugs (say Drug Z) we get p-value of 0.02 and reject the null hypothesis that the Drug Z has no effect.– But this is not right, we just p-hacked.• p-Hacking refers to the misuse and abuse of analysis techniques and results in being fooled by false positives. • Imagine we measured recovery times for a whole lot of people who did not take any drugs to fight the virus. • Then, we fit a normal distribution to all of the recovery times.• The red area under the curve indicates the percentage of people that recovered from the illness within a range of possible values.
• 2.5% of the area under the curve is for durations less than 5 days, indicating that 2.5% of the people recovered in less than 5 days.
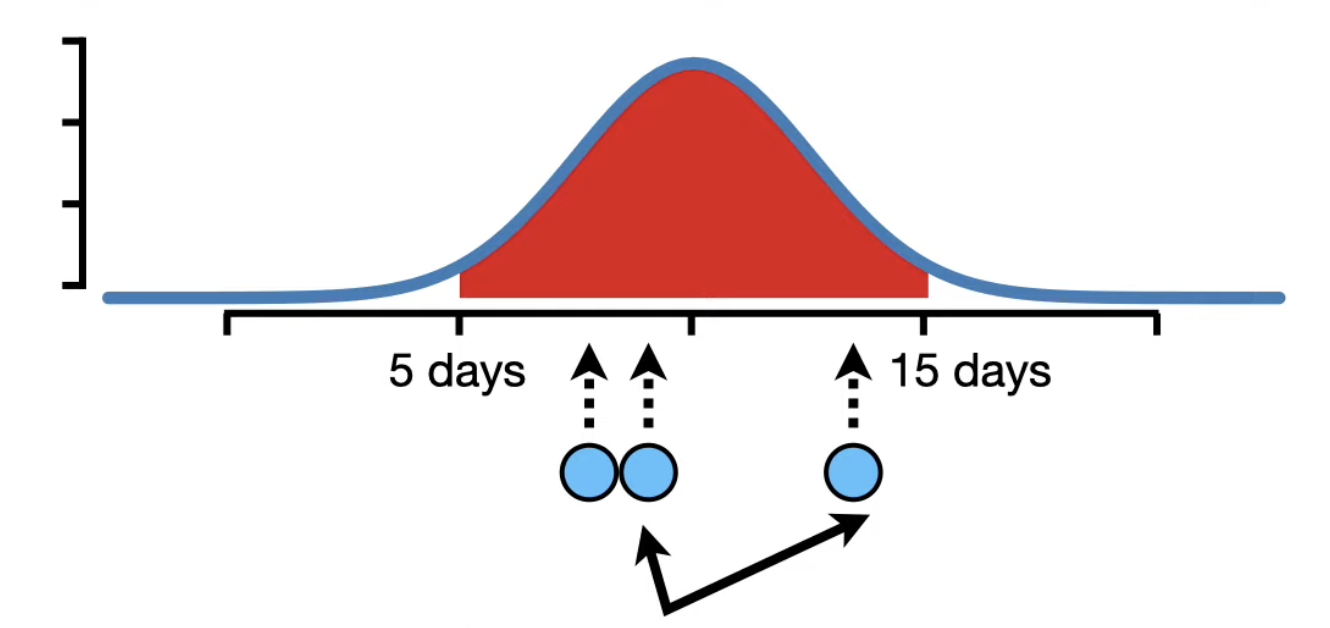
• 95% of the area under the curve is between 5 and 15, indicating that 95% of the people recovered between 5 to 15 days.• Now, we only ask 3 people how long it took them to recover from the illness, there's a good chance all three would say something between 5 to 15 days.
• Now imagine we kept taking two groups of 3 people from the same distribution and testing to see if they are different.• Sooner or later, we may get a group that have p-value < 0.05. – This suggests that the data for these two groups came from the two different distributions which is incorrect, since we know that both samples came from the same distribution, the small p-value is a false positive.• Note:Remember from the previous sections that p-value threshold of 0.05 (or 5% significance) means that approximately 5% of the statistical tests we do on data gathered from the same distribution will result in false positives, i.e. if we do 100 tests, we'd expect 5 false positive. The more tests we do, the more false positives we should expect.• Doing a lot of tests and ending up with false positives is called Multiple Testing Problem.– There are many ways to compensate for the Multiple Testing Problem and reduce the number of false positives.– One popular method is called the False Discovery Rate (FDR).• The main idea behind False Discovery Rate is that you input the p-values for every single comparison and the False Discovery Rate does some simple mathematics and outcome adjusted p-values that are usually larger than the original p-values. Ultimately, some of the tests that we false positives before end up with adjusted p-values > 0.05.– If you want to know more about FDR, refer to this video.• In order for FDR (or any other methods that compensate for Multiple Testing) to work properly, you have to include all of the p-values for all the tests, not just the one that looks like it will give you a small p-value. In other words, don't cherry-pick your data and only do tests that look good.• Typically, when we do experiments, we don't know if they came from the same distribution.– Let's say for two groups (of 3 people) you get p-value close to threshold, say 0.06. – You may hope to get smaller p-value by adding more data.– Let's say, you add one more measurement to each group and get p-value of 0.02. Here, we p-hacked again.• When p-value we get is very close to the threshold (0.05), there's a surprisingly high probability that just adding one new measurement to both groups will result in a false positive.– In other words, even though using a threshold of 0.05 should only result in 5% of the bogus tests giving us false positives, the theory assumes that we only calculate a single value to make a decision. In this case, we calculated two p-values to make our decision.• How do we keep from making this mistake?– In order to avoid making this mistake, we need to determine the proper sample size before doing the experiment. That means we need to do a Power Analysis.– A Power Analysis is performed before doing an experiment and tells us how many replicates we need in order to have a relatively high probability of correctly rejecting the null hypothesis.• In summary,– If you have a bunch of things you want to test out (like a bunch of different drugs), don't just collect all the data, but only calculate a p-value for the one time things look different.– Instead, calculate a p-value for each test and adjust all of the p-values with something like FDR. This will reduce the probability of reporting a false positive.– Also, when you do a test and get a p-value close to 0.05 (but not quite < 0.05), don't just add more observations to the data you already have. – Instead, use the data you have for a power analysis to determine the correct sample size.
4. More Formal DefinitionsHere, we gathered more formal/technical definitions of p-value.4.1. InvestopediaInvestopedia• p-value is the probability of obtaining results at least as extreme as the observed results of a statistical hypothesis test, assuming that the null hypothesis is correct. • The p-value serves as an alternative to rejection points to provide the smallest level of significance at which the null hypothesis would be rejected.• A smaller p-value means that there is stronger evidence in favor of the alternative hypothesis.• P-values are usually found using p-value tables or spreadsheets/statistical software. • These calculations are based on the assumed or known probability distribution of the specific statistic tested. • P-values are calculated from the deviation between the observed value and a chosen reference value, given the probability distribution of the statistic, with a greater difference between the two values corresponding to a lower p-value.– Mathematically, the p-value is calculated using integral calculus from the area under the probability distribution curve for all values of statistics that are at least as far from the reference value as the observed value is, relative to the total area under the probability distribution curve.– The calculation for a p-value varies based on the type of test performed. The three test types describe the location on the probability distribution curve: lower-tailed test, upper-tailed test, or two-sided test.– In a nutshell, the greater the difference between two observed values, the less likely it is that the difference is due to simple random chance, and this is reflected by a lower p-value.• p-value approach to hypothesis testing:– Suppose a study comparing returns from two particular assets was undertaken by different researchers who used the same data but different significance levels. The researchers might come to opposite conclusions regarding whether the assets differ.– To avoid this problem, the researchers could report the p-value of the hypothesis test and allow readers to interpret the statistical significance themselves.• What Does a P-Value of 0.001 Mean?– A p-value of 0.001 indicates that if the null hypothesis tested were indeed true, there would be a one in 1,000 chance of observing results at least as extreme. – This leads the observer to reject the null hypothesis because either a highly rare data result has been observed, or the null hypothesis is incorrect.4.2. WikipediaWikipedia• In null-hypothesis significance testing, the p-value is the probability of obtaining test results at least as extreme as the result actually observed, under the assumption that the null hypothesis is correct. • A very small p-value means that such an extreme observed outcome would be very unlikely under the null hypothesis.• In statistics, every conjecture concerning the unknown probability distribution of a collection of random variables representing the observed data X in some study is called a statistical hypothesis.• If we state one hypothesis only and the aim of the statistical test is to see whether this hypothesis is tenable, but not to investigate other specific hypotheses, then such a test is called a null hypothesis test.• Note: Our hypothesis might specify the probability distribution of X precisely, or it might only specify that it belongs to some class of distributions.• Often, we reduce the data to a single numerical statistic, e.g., T, whose marginal probability distribution is closely connected to a main question of interest in the study. In our examples above, T is the recovery time from the drugs.– Usually, T is a test statistic. A test statistic is the output of a scalar function of all the observations. This statistic provides a single number, such as a t-statistic or an F-statistic. As such, the test statistic follows a distribution determined by the function used to define that test statistic and the distribution of the input observational data.• The p-value is used in the context of null hypothesis testing in order to quantify the statistical significance of a result, the result being the observed value of the chosen statistic T.– The lower the p-value is, the lower the probability of getting that result if the null hypothesis were true.– A result is said to be statistically significant if it allows us to reject the null hypothesis. – All other things being equal, smaller p-values are taken as stronger evidence against the null hypothesis.– Loosely speaking, rejection of the null hypothesis implies that there is sufficient evidence against it.• Consider an observed test-statistic t from unknown distribution T. Then the p-value p is what the prior probability would be of observing a test-statistic value at least as "extreme" as t if null hypothesis H0 were true. That is:– p=Pr(T⩾t|H0) for one-sided right-tail test– p=Pr(T⩽t|H0) for one-sided left-tail test– p=2min{Pr(T⩾t|H0),Pr(T⩽t|H0)} for two-sided test.