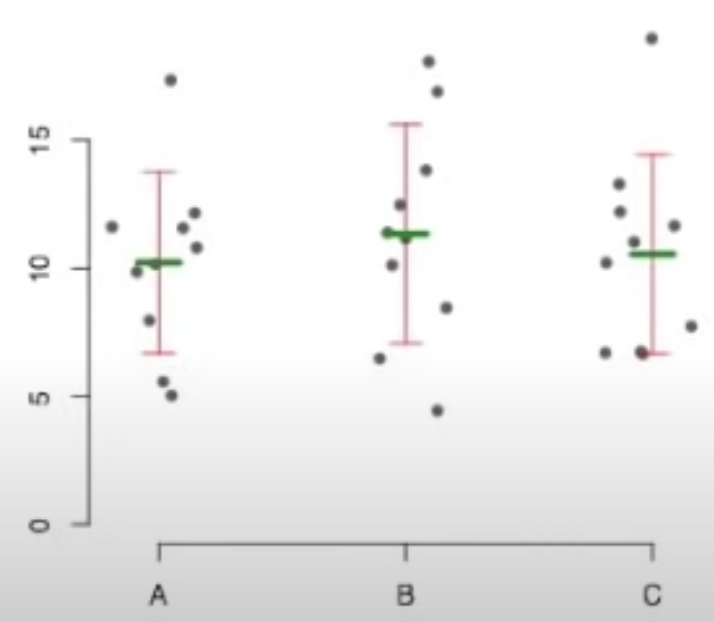
1. Error bars• Error bars are very closely related to standard errors.• For example, you may collect measurements from three samples labeled A, B, and C and plot them on scatter plot and also add the mean and standard deviation to the plot.
Figure 1:Error bars
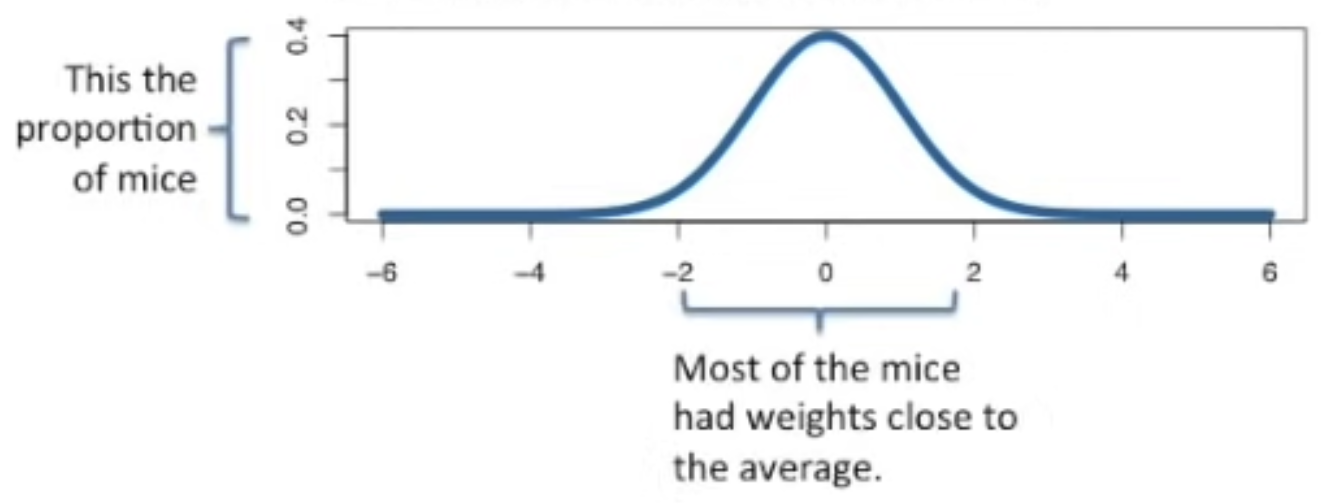
• There are three common types of error bars:– Standard deviations* These tell you how the data is distributed around the mean.* Big standard deviations tell you that some of the data points were pretty far from the mean.* In most cases, this is what you should use in your graphs since it tells us about your data.– Standard errors* These tell you how the mean is distributed.– Confidence intervals* These are related to standard errors.2. Standard error• Let's start with a normal distribution.– In this case, imagine we weighed a lot of mice and plotted a distribution of differences from the mean.
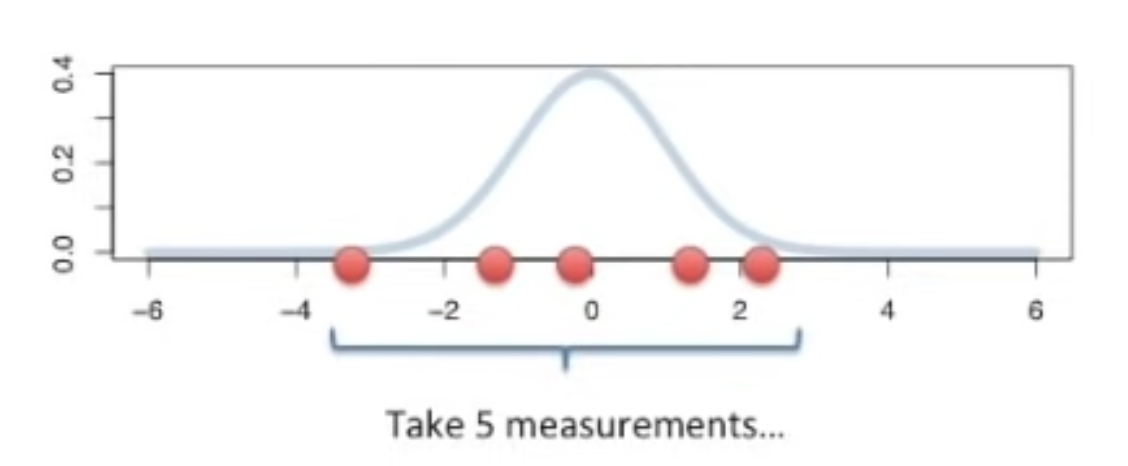
• Most of the mice had weights close to the average. • A few mice weighted much less/more than the average mouse (left/right tail).• Assume we take 5 random measurements from the population (rather than measuring all the mice).– Since most of the mice have weights close to average, most of our samples are close to 0.
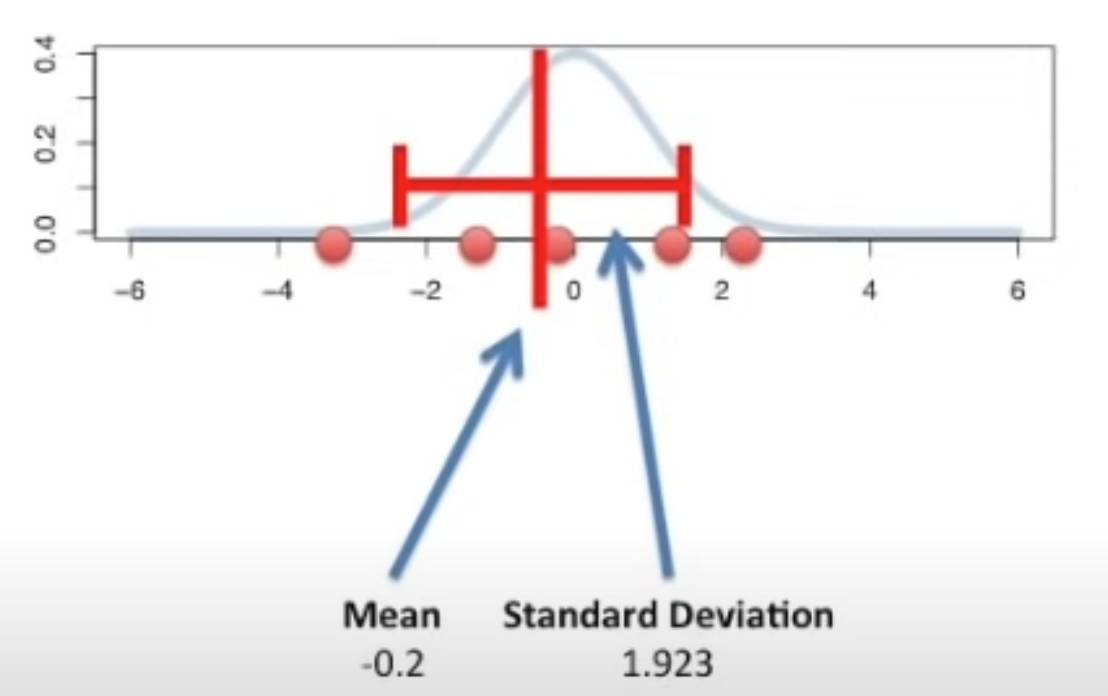
• Now, calculate the mean and standard deviation from our sample:– In our case, mean → -0.2 and standard deviation → 1.923
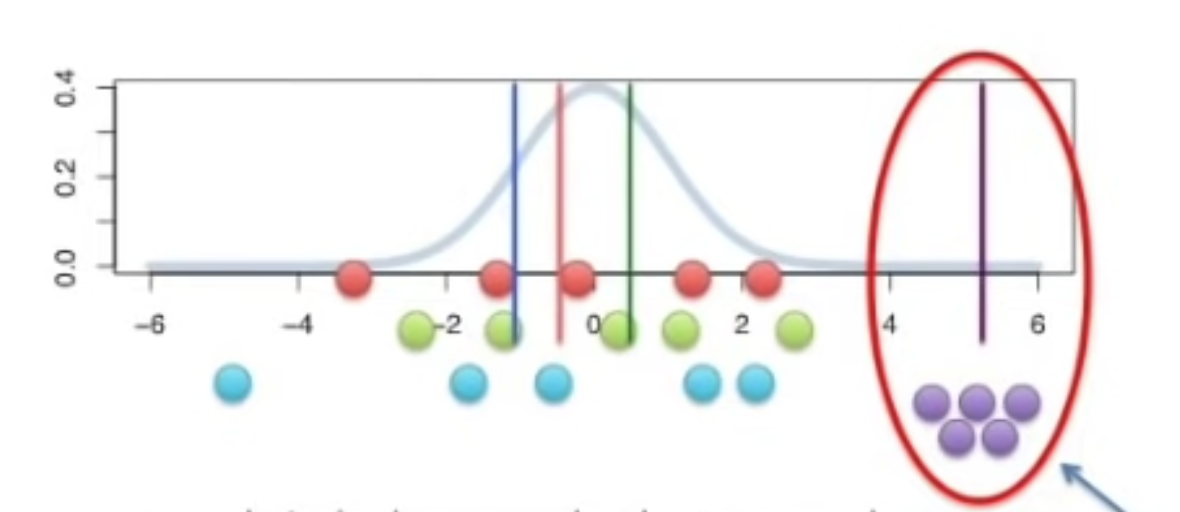
• Note: One standard deviation on each side of the mean is supposed to cover about 68% of the data. Two standard deviation around each side of the mean is supposed to cover about 95% of the data.• Now, let's take few more 5 sample measurements and calculate their mean and standard deviation.• We observe that the means are relatively close to each other compared to the raw data.• Getting all 5 measurements on the tail is very rare (the purple ones). This is because for mean to be way far from the middle, most, if not all of the raw data points would have to be clustered way far away from the middle.– What's more likely is to have a sample where most of the points are close to 0 and only one or two are far away (like the blue ones).
• Now that we all the means (of the samples), we can also calculate the standard deviation of the means.– Note: Standard deviation of the means won't be as wide as the standard deviations of the data.• The standard deviation of the mean → standard error.• This gives us a sense of how much variation we can expect in our "means" if we took a bunch of independent 5 measurement samples.2.1. How to calculate standard error?1. Take a bunch of samples → each with the same number of measurements, or N.2. Calculate the mean of each sample.3. Calculate the standard deviation of the means → standard error2.2. Other types of standard errors• So far, we showed how to calculate the standard error of the mean. But there are other types of standard errors:– Standard deviation of standard deviations → This is called the standard error of standard deviations → it tells us how the standard deviations of multiple samples are dispersed.• You can calculate the standard deviation of any statistic (i.e. median, mode, percentiles, etc.) that you calculate for multiple samples → you get the "standard error of the <statistic>".• Can we calculate standard errors without spending a lot of time/money on doing the experiment a bunch of time?• Yes!– In rare cases, there is a formula you can use to estimate it.* The standard error of the mean is one case → standard deviation⁄N* There aren't many other cases.– You can use bootstrapping for everything else!* It's conceptually very simple.* It's easy to make a computer do the work.3. Calculate standard error using bootstrapping• To bootstrap our data, we do the following steps:(a) Pick a random measurement (from a sample). * This isn't a new measurement that we haven't taken before. It's part of the sample we already have.(b) Now, we repeat step (a).i. Bootstrap is sampling with replacement → i.e. it's OK to sample the same value twice (or a few times).(c) After taking N samples, calculate whatever statistic you're interested in → in our case, we're interested in the standard error of the mean, so we calculate the mean from our new bootstrapped sample.(d) Go back to step (a) and repeat all the way to step (c) → until you have a lot of means (or whatever statistic you're interested in).(e) Once you have enough sample, calculate the standard deviation of the means (or whatever statistic you're interested in).4. Standard error vs. standard deviation• Imagine weighed 5 mice and calculated the average and standard deviation of the measurements.– Standard deviation quantifies how much the data are spread out.• Now imagine we do the exact same experiment 5 separate times, using different mice each time.– This would result in 5 means, one for each set of measurements.– We'd also have 5 separate standard deviations around the means.• The standard deviation of the means is called the standard error.• Standard deviation quantifies the variation within a set of measurements.• Standard error quantifies the variation in the means from multiple sets of measurements.• The confusing thing is that the standard error can be estimated from a single set of measurements, even though it describes the means from multiple sets. Thus, even if you only have a single set of measurements, you are often given the option to plot the standard error.– Note: In almost all cases, you should plot the standard deviation, since graphs are usually intended to describe the data that you measured.